 Open the Pattern window
Graphics visualisation
Open the Pattern window

Parameters:
Choose between Horizontal and Vertical RCS
Add to graph : to view different results on the same graph. The color will be different.
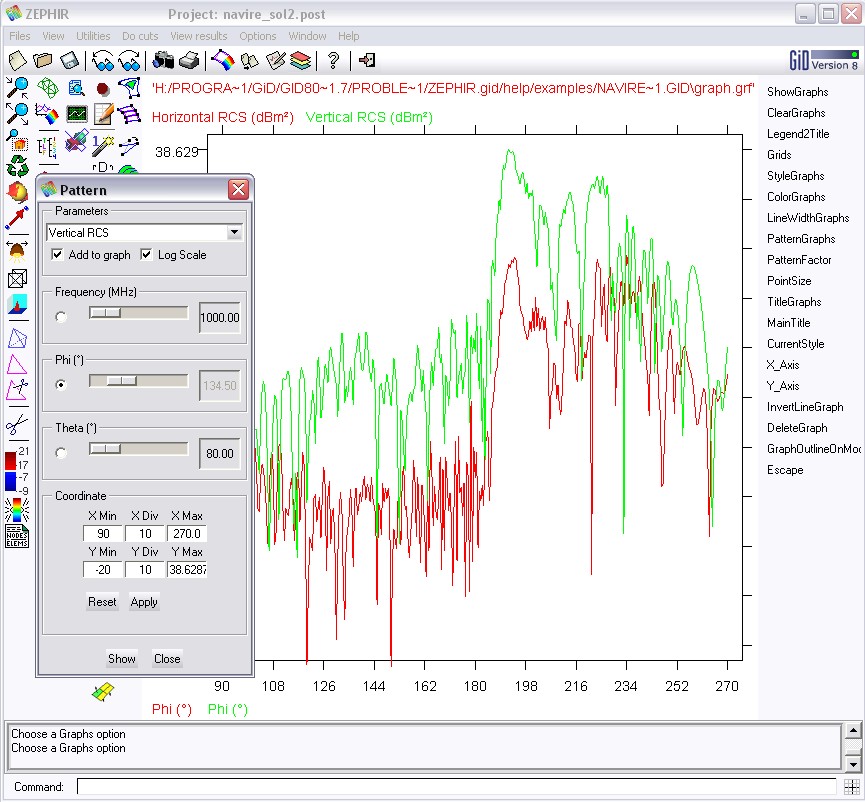
Log Scale : for see values in dBm˛ (or in m˛ if unchecked)
Frequency:
If you have several value you can choose a particular step with the scale.
If you check it, the frequency values will be on abscissa
Phi:
If you have several value you can choose a particular step with the scale.
If you check it, the φ values will be on abscissa
Theta:
If you have several value you can choose a particular step with the scale.
If you check it, the θ values will be on abscissa
Coordinates:
You can change the range of the graph's axis and the number of division for each axis.
Copyright © 2009, IEEA